I’m fascinated by urban agriculture, measuring productive gardens and citizen science. I’m particularly interested in how to help increase the productivity, resource efficiency and financial savings of urban food gardens, to better contribute to urban sustainability.
All of my work has been published open-access in scientific journals, been profiled in the media and I work hard to create public resources to communicate my findings and ideas.
I’m passionate about science communication.
For science to be meaningful, relevant and useful it needs to be effectively communicated. My blog “All kinds of understanding: Successful science communication” covers the ideas, tips, tricks and different perspectives I learn about, read about and realise along the way to trying to become a more effective communicator. By sharing all this, I hope that it will help others who want to improve their communication abilities too.
Are you amazing at presenting, at creating infographics, graphical abstracts, graphs or displays, at explaining ideas to people outside of your field, at story telling? Then please say hi, because I would love to get your perspective on what makes for great communication.
I also run hands-on compost workshops all around Adelaide, SA.
I’ve always been captivated by gardens, their small jungles of flowers, insects, unfurling greens and rich soils. For me, composting is a great way to recycle my food waste, learn more about how things break down, and get my hands dirty making something special for my garden.
My Research
PhD | Productivity, resource efficiency and financial savings: An investigation of the current capabilities and potential of South Australian home food gardens
The Edible Gardens Project – UniSA
A project designed to explore how and why people grow food in urban areas.
This project is now completed! Here you can download a copy of the raw (and partially analysed) data to view, use and even compare your garden with. Also see the publications page for the 5 scientific articles (and several reports) based on the Edible Gardens project.
A huge thank you to everyone who contributed their time and effort to this project, we could not have done this without you.
This citizen science project was open to all South Australian home, community and school gardens. Participating gardeners grew all kinds of herbs, vegetables and fruits. They also kept urban livestock such as chickens, other poultry, fish and bees.


(This image shows profile pictures of many of the gardens involved!)
The project had two parts – 465 people completed an online survey about their food gardens, and 71 people registered to collect data on their own food gardens.
- PART ONE: the online survey – this survey was open to anyone aged 18+ living in South Australia who grew food. The survey asked questions about why people grew some of their own food, what challenges they experienced and whether they preserved or shared any of the food they grew. It also asked respondents to describe their food garden. This survey is now closed.
- PART TWO: garden data collection – we included as many gardens as possible. People volunteered their gardens and selected gardeners were posted out a Data Collection Toolkit (we had a limited number of these). Each toolkit contained at least one water meter, a spring-balance, data sheets, instructions, a clipboard and pencil. Selected gardeners were posted the toolkit and asked to measure 5 things:
- Time spent on different food-gardening activities.
- Money spent on food-garden related costs.
- Water applied to food gardens (we provided water meters).
- Food produced (crop type and yield).
- Food shared with others outside of the household.
Data collection
What did this involve?
Selected gardeners were sent a registration email, with instructions for how to register their garden in the Edible Gardens system. Once registered – we posted people out a Data Collection Toolkit. The toolkit contained all the tools and information they needed to help them collect data on their garden.
This part of the project was quite “hands-on” and our participants were prepared to keep their clipboard and blank data sheets (provided in the toolkit) near them while they worked on their food gardens. They needed to think about how much time they spent on different gardening activities, such as “planting/sowing”, or “pest control”. They also needed to check their water meters regularly to see how many litres of water were applied to their food gardens.
How much time did this take people?
- Registering gardens took approximately 15 minutes – we asked people about the different garden areas they chose to collect data on, such as size, type of area, water source/s and irrigation method/s.
- It took most gardeners around ½ an hour to familiarise themselves with the toolkit and install the water meter/s.
- Typically, ongoing data collection took 10-15 minutes per day (on the days participants tended their gardens). This time included the recording the amount of time spent, any water applied and weighing any produce harvested.
- Entering data online typically took between 10-20 minutes (once a fortnight). Once data were entered and saved, online results were automatically updated.
What did people get in return for collecting data?
Downloadable data and interactive online charts for easy comparisons: All the data a participant collected and entered into our system was available to download for their own records and analysis. When they entered new data, their results were automatically displayed as interactive charts (see below). With these charts you can compare separate areas in one garden for their water use, time spent, harvest yield and water use efficiency. You can also compare one garden with any other gardens in the Edible Gardens project. These charts can be downloaded and saved by anyone.
A nutritional and retail value report on all the results from their food garden: our participants will be sent a final report. This report will provide results from their different garden areas, plus information about the nutritional and retail value of the food they grew. Our nutritional data analysis was based on commercial nutritional values from the NUTTAB database. Our retail value analysis was based on supermarket produce prices tracked over the life of the project.
Why did we need your help?
Because everyone grows food in different ways and for different reasons! We wanted to learn as much as we could about urban food gardens, but we are a small team of scientists and can’t visit and monitor enough food gardens by ourselves. This is where Citizen Scientists came in. Members of the public helped our research by answering our online survey, and volunteered to collect data on their own food gardens.
Growing food in urban areas is also known as “urban agriculture”. Previous research has found that over half of all South Australian households grow some of their own food! However, we still know very little about how much food these urban gardens can produce, or how much time, money or water it takes to grow that food. This kind of information is important for a numbers of reasons:
“Does the way you grow food best match the results that you’re after for your garden?”
For example, you might want to grow lots of food but not use too much water – but without measuring the amount of water you apply to your food garden, how can you know if what you’re doing is working? Or what if you want to save money? Do you track your costs?
By collecting data on all different kinds of real food gardens, we can start to become more aware of what goes into and what comes out of our food gardens.
Our progress so far
Both Phase 1 and Phase 2 (the data collection parts) of the project are now completed, but we have managed to produce 5 scientific articles based on the project findings and multiple reports (including a water use efficiency manual for home gardeners!). See the publications, reports and resources page for more details.
Below you can see how many people participated in the original Edible Gardens online survey and the spread of suburbs and postcodes across South Australia. Please Note: no individuals’ address is identified (this map shows suburb or town markers only). Click on the map to enable zooming and moving!
Examples of our interactive data charts
While the garden data collection phase was running, participants were able to enter their data into our system, and then had graphs automatically and instantly display the preliminary results for each individual garden. These online graphs were used to compare growing areas within individual gardens (for example in the first image below), or could even be used to compare results between different gardens (for example, see the second image below).
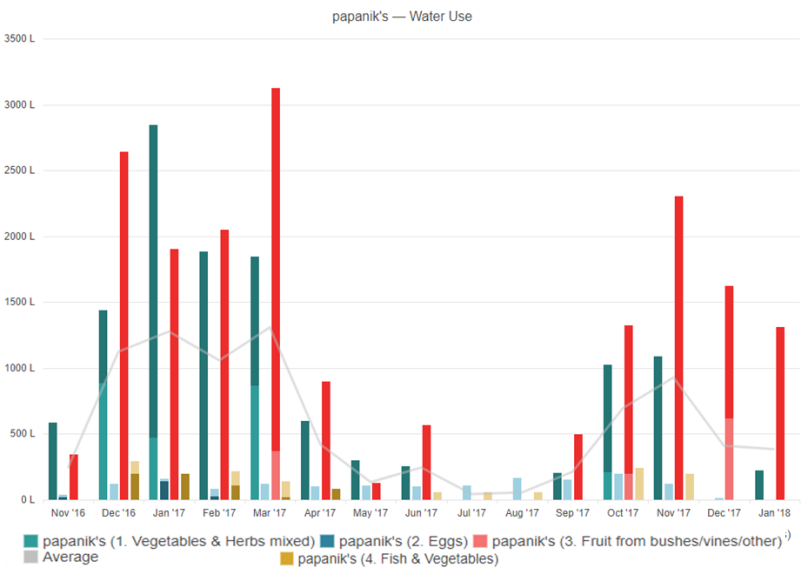
Their results including productivity, water use, labour and expenses could all be viewed as totals running over time, or as values per square metre to help compare garden areas or different sizes.

Stories from our citizen scientists…
Liz’s little garden story
“Hi my name is Liz, gardening has been something I have done since I was a child. Now with my husband we have 2 ½ acres at Sandy Creek. As far back as I can remember my dad would come up from working on the vineyard past the vegetable garden and orchard with produce for dinner. Nothing was ever wasted, if not passed on to family and friends, made into preserves sauces etc or frozen down. We (my brothers and I) were expected to help from young age, we called it working for our pocket money, but looking back we were being taught a lot of life lessons.
Jumping forward 35 years, we bought our own little property at Sandy Creek. Bare paddock with old hayshed and 3 gumtrees, and some desert ashes. House plans drawn up builder found and next new home for us. Whilst this was happening we started to plan our gardens. Our soil is pure sand, with rock and little bit clay on ridge, so we decided most the garden would be natives. Then up around the house is where I have my roses, some fruit trees, and other plants that require a bit more water.
Down the path to the Vegetable garden, chooks and orchard. We started with recycled corrugated iron beds, which were great in winter, but summer only small amount of beds were useful. Mainly due to hot winds on top of the ridge. So Potting, Wood, and garden sheds were built around the garden area. So after lots of hard work, we now have enclosed vegetable garden, that produces well. We mainly grow Mediterranean type vegetables, excepting in winter when I try different seedlings. We work on 5 bed rotation system.
Our garden has had many failures, but they are opportunities to try new things. With lots of plants grown from seed, or cuttings or plants given to us by family and friends. Large areas are natives, which means for us abundant bird and wild life We have created our on slice of paradise from paddock to garden in 12 years.” – Liz, Sandy Creek
Smokey & Kathy’s Patch
“Growing our own fruit and vegetables seems to us like a “normal” thing to do. Both our parents had productive gardens and they helped to feed us growing up. Of course, we realize that it is not “normal” any more. Most people no longer have the skills, space, time or motivation. But we do. It is something we have done since we have been together – 35 years!
We estimate we’ve grown about $100,000 worth of food in that time. With preserving, cooking and sharing it has certainly saved us more than this over the years.
Yes, the garden saves us money but it does much more than that. Our children helped to plant, grow and pick the produce. It taught them the value of simple things in life – including food. Our food is fresh, healthy and tasty. People often comment to us about how nice our food is compared to bought food. It is also satisfying to grow food. It’s not instant, you have your disappointments, and it can be frustrating. However, it’s rewarding when you bring in a container full of produce. We enjoy giving produce to friends.
We try to grow things that we use a lot, that grows well in our garden, that store well and is easy. We have learnt this over the years – by trial and error. Kathy usually cooks meals based on what we have produced – fresh or preserved. Our most productive plants (in order of value) are; tomatoes, apricots, peaches, zucchini, silver beet, boc choy, rhubarb, lettuce, onions, parsley, nectarines, broccoli, asparagus, oranges, beetroot, carrots and chives. We also have some things are not very productive at all.” – Brian, Port Lincoln
Questions & Answers
- Why is data collection closed now?
It’s now time to analyse our results, so that we can share what we’ve learnt. We have a large quantity of valuable data collected with considerable effort (thank you again to everyone involved!) - I’m a current registered participant, can I keep collecting data for myself?
While we are no longer collecting data, we encourage people to continue. Our online system has closed, but if you download your data as an excel spreadsheet you can continue to monitor your inputs and yields. - I’m interested in hearing about the results from this project, where can I find out more?
Visit the collection of reports, publications and presentations. - This project sounds really interesting! Is it open to any other states in Australia, or other countries?
A great deal of time, money and work went into developing all the online infrastructure for this project. We’re open to conversations about providing advice for how to set up similar projects elsewhere.
Project team & Funding
- Dr Georgia Csortan (School of Natural & Built Environments, UniSA
- Dr James Ward (School of Natural and Built Environments, UniSA)
- Dr Philip Roetman (Post-Discovery Circle, UniSA)
This research was supported by an Australian Government Research Training Program (RTP) Scholarship, with additional funding and support from:

Regards,
Georgia the Urban Ag. Scientist


Hello, I’ve nominated you for a Liebster Award – https://olivemegamean.wordpress.com/2016/08/25/liebster-award/
Check it out !
LikeLiked by 1 person
Cheers Olive 🙂 that is very cool!
LikeLiked by 1 person
Great website, thanks!
LikeLiked by 1 person